R Code
library(reticulate)Combining Python’s powerful data processing with R’s rich data visualization and statistical libraries.
May 4, 2019
August 3, 2026
Python is fantastic for general data manipulation, but I find that R excells at data visualization, and its large array of specialized statistical libraries. Since both of these ecosystems have their strengths, I often find myself wanting to combine features of both in a single workflow. Nevertheless, I want to avoid the task of having to write duplicate data munging operations in both languages.
Below, I’ll demonstrate how to use:
I’m using the mtcars dataset for some examples because it’s small, but at the end, we’ll discuss how Arrow helps when data sets are large, where copying everything in memory repeatedly is no longer practical.

Reticulate is an R package that provides a Python interface for R. It allows R users to share objects between R and Python sessions.
Installing the reticulate package in R:
Loading the reticulate library:
Let’s create some simple Python arrays and plot them:
Python Code

Because I am using Quarto, we can call Python code directly in the same notebook as R code. However in a traditional R script we would call Python code like this:
Or alternatively,
Or, if we want to run an entire Python script:
Finally, we can access these same Python objects from inside an R code cell:
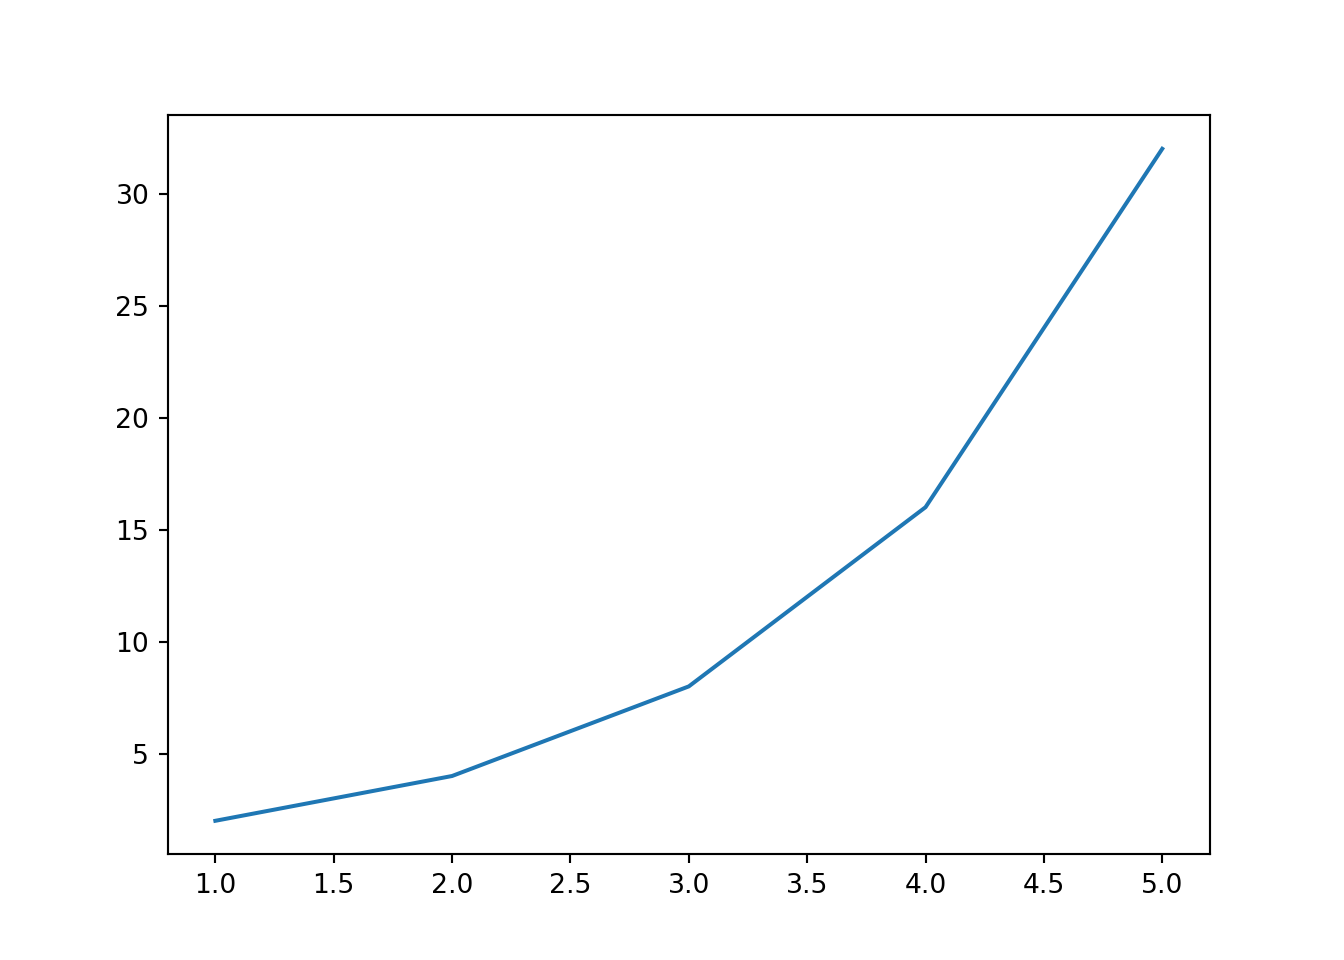
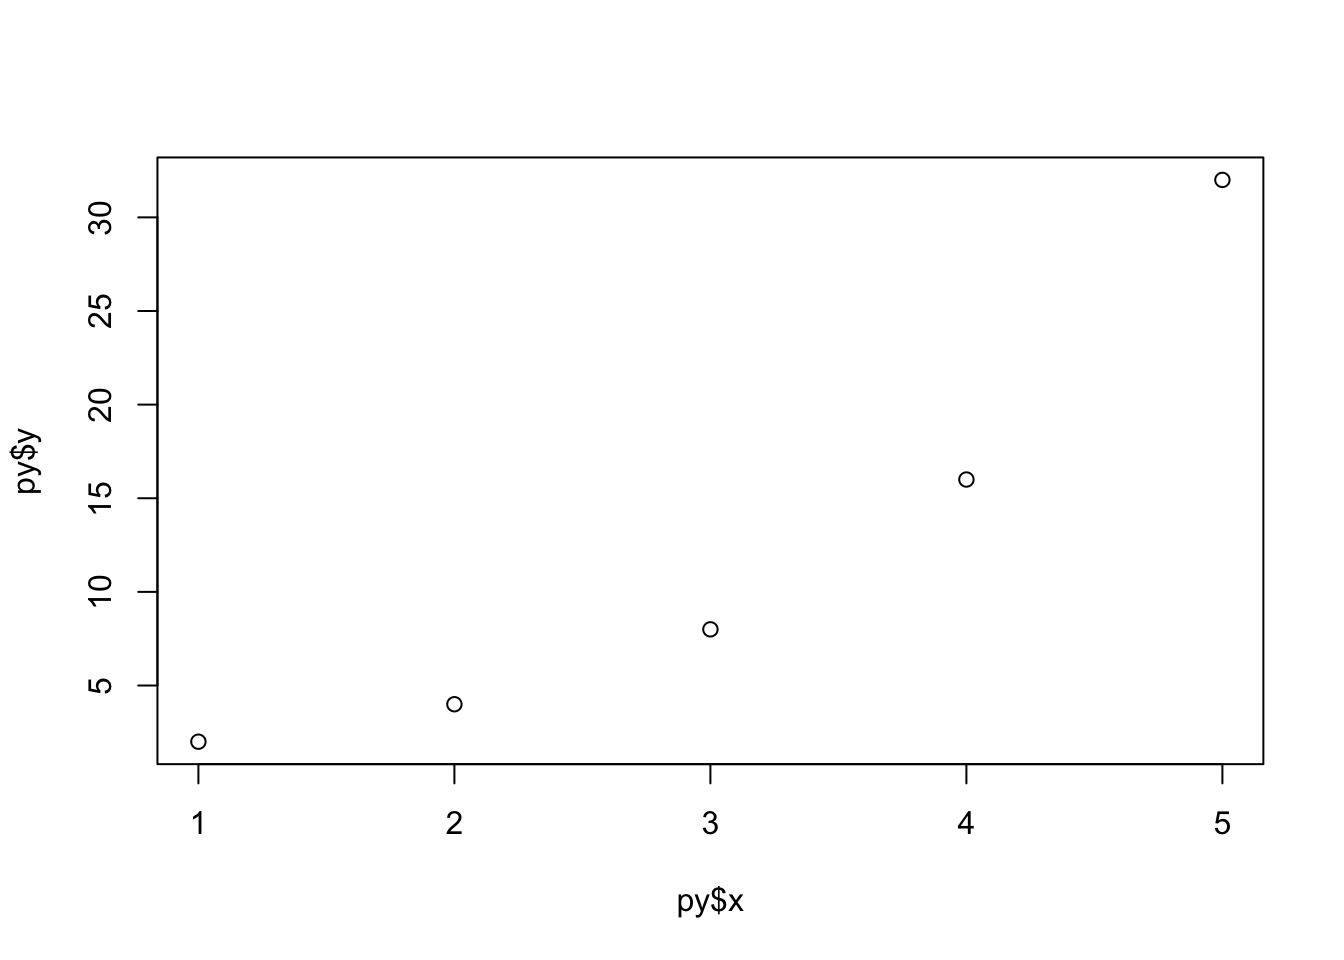
In this example, we created Python arrays and visualized them with both Python’s Matplotlib and R’s plotting system. The py$ syntax accesses Python objects from within R, allowing for seamless interoperation.
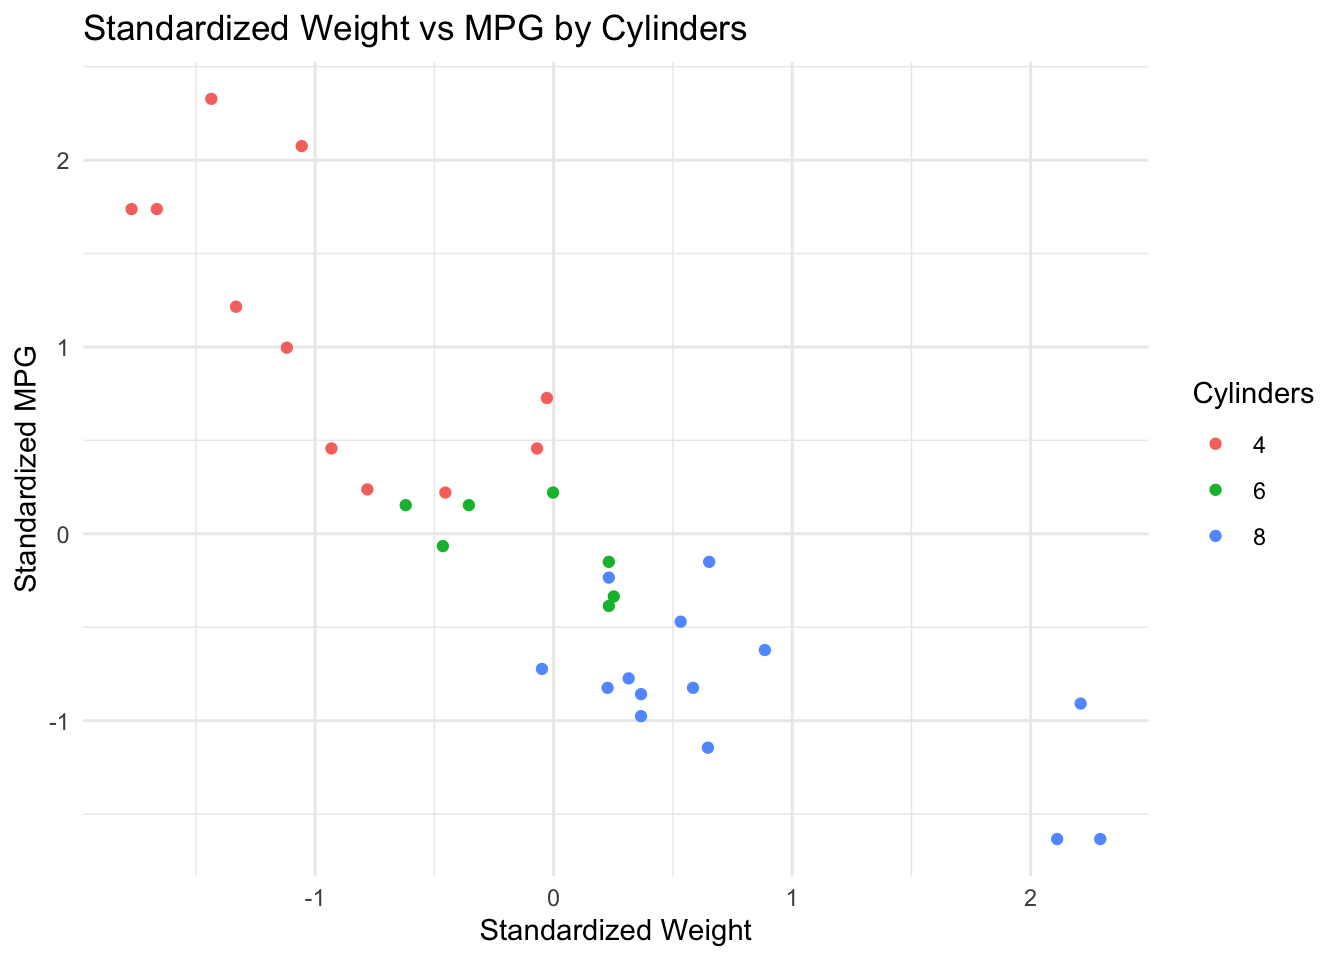
For accessing R objects from Python, we can use the r. prefix. Here we load the mtcars dataset in R and access it from Python’s Pandas library, where we use SciKit Learn to apply a data transformation:
Python Code
# Python Code
import pandas as pd
import numpy as np
from sklearn.preprocessing import StandardScaler
# Access mtcars from R and do some Python-specific analysis
mtcars_py = r.mtcars
numeric_cols = ['mpg', 'disp', 'hp', 'drat', 'wt', 'qsec']
scaler = StandardScaler()
mtcars_py[numeric_cols] = scaler.fit_transform(mtcars_py[numeric_cols])
mtcars_py.head()StandardScaler
mpg cyl disp hp ... vs am gear carb
Mazda RX4 0.153299 6.0 -0.579750 -0.543655 ... 0.0 1.0 4.0 4.0
Mazda RX4 Wag 0.153299 6.0 -0.579750 -0.543655 ... 0.0 1.0 4.0 4.0
Datsun 710 0.456737 4.0 -1.006026 -0.795570 ... 1.0 1.0 4.0 1.0
Hornet 4 Drive 0.220730 6.0 0.223615 -0.543655 ... 1.0 0.0 3.0 1.0
Hornet Sportabout -0.234427 8.0 1.059772 0.419550 ... 0.0 0.0 3.0 2.0
[5 rows x 11 columns]
A downside of this approach is that it is slow for large datasets, as we are creating a copy of the object in memory when we pass it from R to Python, or vice-versa.
Another caveat is that some Python objects do not map directly to R objects, so we may need to convert them. For example, a Pandas DataFrame in Python is not directly convertible to an R data frame. However, we can convert it to a dictionary and then to an R data frame.
Accessing our transformed mtcars DataFrame from R:
R Code
library(ggplot2)
# Convert the dictionary to an R data frame
standardized_data <- data.frame(py$mtcars_dict)
ggplot(standardized_data, aes(x = wt, y = mpg, color = factor(cyl))) +
geom_point() +
theme_minimal() +
labs(title = "Standardized Weight vs MPG by Cylinders",
x = "Standardized Weight",
y = "Standardized MPG",
color = "Cylinders")
A more efficient way to share data between R and Python is to use Apache Arrow which we will discuss next.
For sharing large datasets, you might want to consider Apache Arrow. Arrow provides a language-agnostic columnar memory format, enabling fast data exchange between R, Python, and other systems.
In Python, we can install the pyarrow package with pip install pyarrow, and in R, we can install the arrow package with install.packages("arrow").
We can always use Arrow to write out a Parquet file and read it in in another language, but in cases where we want to avoid IO, we can combine Arrow with reticulate (or rpy2!) to share data between R and Python directly in memory. For example, we can read the mtcars dataset into an Arrow table in R and then read it from Python:
Accessing the mtcars Arrow dataset from Python:
Python Code
cyl mpg_mean
0 6.0 19.742857
1 4.0 26.663636
2 8.0 15.100000
Conversely, if we have a Pandas DataFrame in Python, we can convert it to an Arrow table and access it from R:
a b
1 1 4
2 2 5
3 3 6
The advantage of using Arrow is that the object representation remains the same between R and Python (and other languages that implement the format), so we avoid the overhead of copying the data. We are simply passing a reference to the same object in memory and updating the metadata.
Reticulate makes interfacing Python and R code nearly seamless, especially when working in a Quarto notebook, and with the addition of Apache Arrow, we can efficiently share large datasets between the two languages.
However, while Reticulate works great if you are working in an R-based environment, it is also common to start out in a Python environment and have need of an R library (e.g., a Bioconductor package or plotting function). In such cases, we can use rpy2, a Python package that provides an interface to call R code from Python. Additionally, rpy2-arrow provides an extension for using Apache Arrow with rpy2. It would probably make this blog post too long to cover rpy2 in detail, but this blog did an excellent job of explaining how to use it: Data transfer between Python and R with rpy2 and Apache Arrow.
I am excited to try out these workflows more extensively, and leverage some of the strengths of both languages via some Franken-pipelines! What are your favorite use cases for combining Python and R?
Nowadays, I do most of my coding in VS Code for both R and Python.↩︎
---
title: "Interweaving R and Python with Reticulate and Apache Arrow"
description: |
Combining Python's powerful data processing with R's rich data visualization and statistical libraries.
date: "2019-05-04"
date-modified: last-modified
categories:
- Python
- Rstats
- dataviz
format:
html:
code-tools:
source: true
code-annotations: hover
---
Python is fantastic for general data manipulation, but I find that R excells at data visualization, and its large array of specialized statistical libraries. Since both of these ecosystems have their strengths, I often find myself wanting to combine features of both in a single workflow. Nevertheless, I want to avoid the task of having to write duplicate data munging operations in both languages.
Below, I’ll demonstrate how to use:
- Reticulate to call Python code from R (and pass objects between them)
- Apache Arrow for fast, language-agnostic data sharing between the two languages
I'm using the mtcars dataset for some examples because it’s small, but at the end, we’ll discuss how Arrow helps when data sets are large, where copying everything in memory repeatedly is no longer practical.
## Reticulate
### What is Reticulate?
{width=300 fig-align="center"}
Reticulate is an R package that provides a Python interface for R. It allows R users to share objects between R and Python sessions.
:::{.callout-note}
Reticulate is especially powerful in [Quarto](https://quarto.org/docs/get-started/), which supports both R and Python chunks natively in the same document, and works with any text editor. [^1] This is the setup I am using to write this blog.
:::
[^1]: Nowadays, I do most of my coding in VS Code for both R and Python.
Installing the reticulate package in R:
```r
install.packages("reticulate")
```
Loading the reticulate library:
```{r filename="R Code"}
library(reticulate)
```
### A Quick Python–R Integration Example
Let's create some simple Python arrays and plot them:
```{python filename="Python Code"}
#| label: array-from-python
import numpy as np
import matplotlib.pyplot as plt
x = np.array([1, 2, 3, 4, 5])
y = np.exp2(x)
plt.plot(x, y)
plt.show()
```
Because I am using Quarto, we can call Python code directly in the same notebook as R code. However in a traditional R script we would call Python code like this:
```{r filename="R Code"}
np <- import("numpy", "np")
x <- np$array(c(1, 2, 3, 4, 5))
y <- np$exp2(x)
```
Or alternatively,
```{r filename="R Code"}
py_run_string("
import numpy as np
x = np.array([1,2,3,4,5])
y = np.exp2(x)
")
```
Or, if we want to run an entire Python script:
```r
py_run_file("python_script.py")
```
Finally, we can access these same Python objects from inside an R code cell:
```{r filename="R Code"}
#| label: array-from-r
# Plotting the same arrays in R! So simple!
plot(py$x, py$y)
```
In this example, we created Python arrays and visualized them with both Python’s Matplotlib and R’s plotting system. The ```py$``` syntax accesses Python objects from within R, allowing for seamless interoperation.
### Accessing R objects from Python
For accessing R objects from Python, we can use the `r.` prefix. Here we load the mtcars dataset in R and access it from Python's Pandas library, where we use SciKit Learn to apply a data transformation:
```{r filename="R Code"}
data(mtcars)
```
```{python filename="Python Code"}
# Python Code
import pandas as pd
import numpy as np
from sklearn.preprocessing import StandardScaler
# Access mtcars from R and do some Python-specific analysis
mtcars_py = r.mtcars
numeric_cols = ['mpg', 'disp', 'hp', 'drat', 'wt', 'qsec']
scaler = StandardScaler() # <1>
mtcars_py[numeric_cols] = scaler.fit_transform(mtcars_py[numeric_cols]) # <1>
mtcars_py.head()
```
1. Standarizing numeric columns with scikit-learns's `StandardScaler`
:::{.callout-warning}
A downside of this approach is that it is slow for large datasets, as we are creating a copy of the object in memory when we pass it from R to Python, or vice-versa.
Another caveat is that some Python objects do not map directly to R objects, so we may need to convert them. For example, a Pandas DataFrame in Python is not directly convertible to an R data frame. However, we can convert it to a dictionary and then to an R data frame.
:::
Accessing our transformed mtcars DataFrame from R:
```{python filename="Python Code"}
# Convert the Pandas dataframe to a dictionary
mtcars_dict = mtcars_py.to_dict(orient='list')
```
```{r filename="R Code"}
#| label: mtcars-ggplot
library(ggplot2)
# Convert the dictionary to an R data frame
standardized_data <- data.frame(py$mtcars_dict)
ggplot(standardized_data, aes(x = wt, y = mpg, color = factor(cyl))) +
geom_point() +
theme_minimal() +
labs(title = "Standardized Weight vs MPG by Cylinders",
x = "Standardized Weight",
y = "Standardized MPG",
color = "Cylinders")
```
A more efficient way to share data between R and Python is to use Apache Arrow which we will discuss next.
## Using Apache Arrow for Large Data Interchange
For sharing large datasets, you might want to consider [Apache Arrow](https://arrow.apache.org/). Arrow provides a language-agnostic columnar memory format, enabling fast data exchange between R, Python, and other systems.
:::{.callout-note}
In Python, we can install the pyarrow package with `pip install pyarrow`, and in R, we can install the arrow package with `install.packages("arrow")`.
:::
### In-memory data sharing with Arrow
We can always use Arrow to write out a Parquet file and read it in in another language, but in cases where we want to avoid IO, we can combine Arrow with reticulate (or rpy2!) to share data between R and Python directly in memory. For example, we can read the mtcars dataset into an Arrow table in R and then read it from Python:
```{r filename="R Code"}
suppressPackageStartupMessages(library(arrow)) # <1>
mtcars_arrow <- arrow_table(mtcars) # <2>
```
1. Silencing some package startup messages when loading the arrow library
2. Converting the mtcars dataset to an Arrow table
Accessing the mtcars Arrow dataset from Python:
```{python filename="Python Code"}
import pyarrow as pa
mtcars_py = r.mtcars_arrow
# An aggregation example in pyarrow
mtcars_py.group_by('cyl').aggregate([('mpg', 'mean')]).to_pandas()
```
Conversely, if we have a Pandas DataFrame in Python, we can convert it to an Arrow table and access it from R:
```{python filename="Python Code"}
# Convert a Pandas DataFrame to an Arrow table
df = pd.DataFrame({'a': [1, 2, 3], 'b': [4, 5, 6]})
table = pa.Table.from_pandas(df)
```
```{r filename="R Code"}
# Access the arrow table from R
df <- py$table
as.data.frame(df) # <1>
```
1. Not always necessary, but we can convert the Arrow table to an R data frame
The advantage of using Arrow is that the object representation remains the same between R and Python (and other languages that implement the format), so we avoid the overhead of copying the data. We are simply passing a reference to the same object in memory and updating the metadata.
## Wrapping up
Reticulate makes interfacing Python and R code nearly seamless, especially when working in a Quarto notebook, and with the addition of Apache Arrow, we can efficiently share large datasets between the two languages.
However, while Reticulate works great if you are working in an R-based environment, it is also common to start out in a Python environment and have need of an R library (e.g., a Bioconductor package or plotting function). In such cases, we can use [rpy2](https://rpy2.github.io/), a Python package that provides an interface to call R code from Python. Additionally, [rpy2-arrow](https://rpy2.github.io/rpy2-arrow/version/main/html/index.html) provides an extension for using Apache Arrow with rpy2. It would probably make this blog post too long to cover rpy2 in detail, but this blog did an excellent job of explaining how to use it: [Data transfer between Python and R with rpy2 and Apache Arrow](https://blog.djnavarro.net/posts/2022-09-16_arrow-and-rpy2/).
I am excited to try out these workflows more extensively, and leverage some of the strengths of both languages via some Franken-pipelines! What are your favorite use cases for combining Python and R?
## References and Further Reading
- [Apache Arrow R Cookbook](https://arrow.apache.org/cookbook/r/creating-arrow-objects.html)
- [Data transfer between Python and R with rpy2 and Apache Arrow](https://blog.djnavarro.net/posts/2022-09-16_arrow-and-rpy2/)
- [Calling R from Python with rpy2](https://rviews.rstudio.com/2022/05/25/calling-r-from-python-with-rpy2/)